

Air Quality & Health Challenge
Challenge closed
Introduction
The Copernicus Programme and NewSpace constellations have strongly increased the availability of Earth Observation (EO) data and of derived information services, including information from complex geophysical models and measurements from in situ instruments. Nowadays, a large amount of that information is easily accessible and can be obtained free of charge. The availability of several information sources allows the implementation of novel applications thanks to the introduction of Artificial Intelligence (AI) techniques that are enabling the speed-up and integrated analysis of EO data and other information layers. In particular the application of AI and Machine Learning are demonstrating their effectiveness in revealing patterns among different kind of heterogenous data and are enabling to easily discover relationships between EO and in situ measurements. This means that the EO community can immensely profit from AI and that the AI community can provide an invaluable contribution for monitoring and understanding the processes and transformations happening on our Planet.
To know more about the data and how to compute the different metrics go here.
Aim of the Challenge
The aim of the challenge is to develop novel AI based algorithms for improving air quality monitoring and, specifically, of PM2.5 and NO2.
PM2.5
PM stands for particulate matter of solid particles and liquid droplets present in the air. Some particles, such as dust, dirt, soot, or smoke, are large or dark enough to be seen with the naked eye. Others are so small they can only be detected using an electron microscope. This type of pollutant includes:
- PM10 : inhalable particles, with diameters that are generally 10 micrometers and smaller;
- PM2.5 : fine inhalable particles, with diameters that are generally 2.5 micrometers and smaller.
PM particles are so small that they can be inhaled and cause serious health problems. PM10 can get deep into your lungs and some may even get into your bloodstream. PM2.5 pose the greatest risk to health.
NO2
Nitrogen Dioxide (NO2) is one of a group of highly reactive gases known as oxides of nitrogen or nitrogen oxides (NOx). NO2 is used as the indicator for the larger group of nitrogen oxides. NO2 primarily gets in the air from the burning of fuel. NO2 forms from emissions from cars, trucks and buses, power plants, and off-road equipment.
Breathing air with a high concentration of NO2 can irritate airways in the human respiratory system. Such exposures over short periods can aggravate respiratory diseases, particularly asthma, leading to respiratory symptoms (such as coughing, wheezing or difficulty breathing), hospital admissions and visits to emergency rooms. Longer exposures to elevated concentrations of NO2 may contribute to the development of asthma and potentially increase susceptibility to respiratory infections. People with asthma, as well as children and the elderly are generally at greater risk for the health effects of NO2.
NO2 along with other NOx reacts with other chemicals in the air to form both particulate matter and ozone. Both of these are also harmful when inhaled, due to effects on the respiratory system.
The Earth Observation Contribution
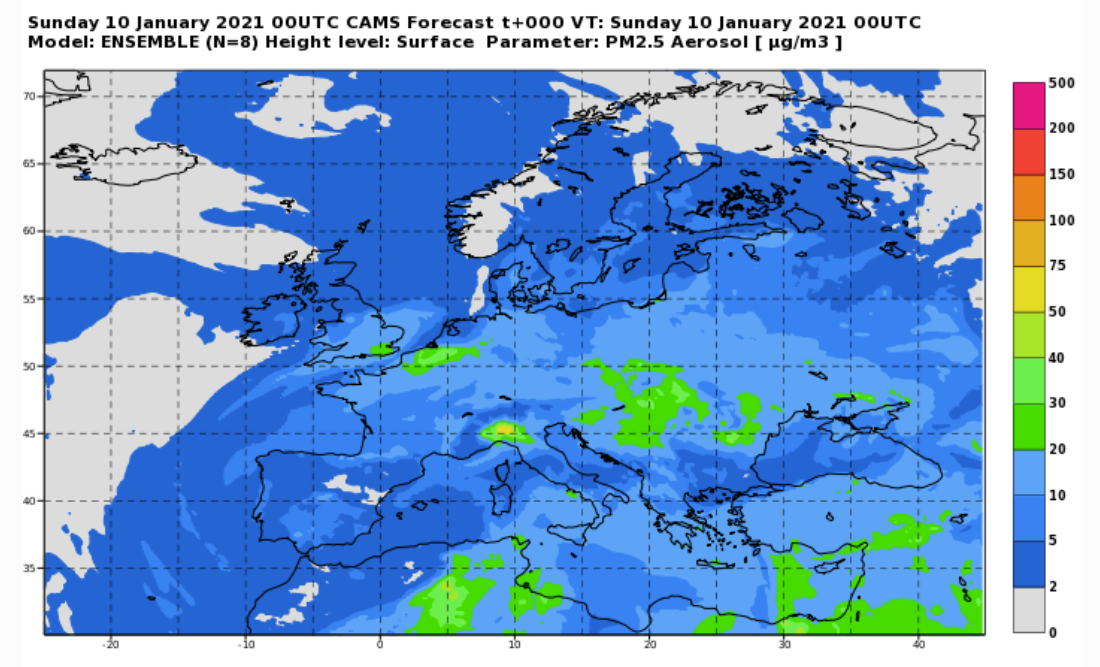
In the "Air Quality & Health" challenge, the participants have to analyse the datasets provided by AI4EO and to prototype an AI based solution for improving the spatial resolution of the air quality monitoring information provided by the Copernicus Atmosphere Monitoring Service (for PM2.5) and by ESA Sentinel5 product (for NO2). More specifically, the goal of the challenge is to implement an AI based model for improving the spatial resolution of the PM2.5 and NO2 native data provided respectively by Copernicus and ESA:
- PM2.5:
- From 10Km x 10Km over North Italy to the final resolution of 1x1Km;
- From 40Km x 40Km over South Africa and California to the final spatial resolution of: 10 x 10Km
- NO2: from 7x7Km to the final resolution of 1x1Km
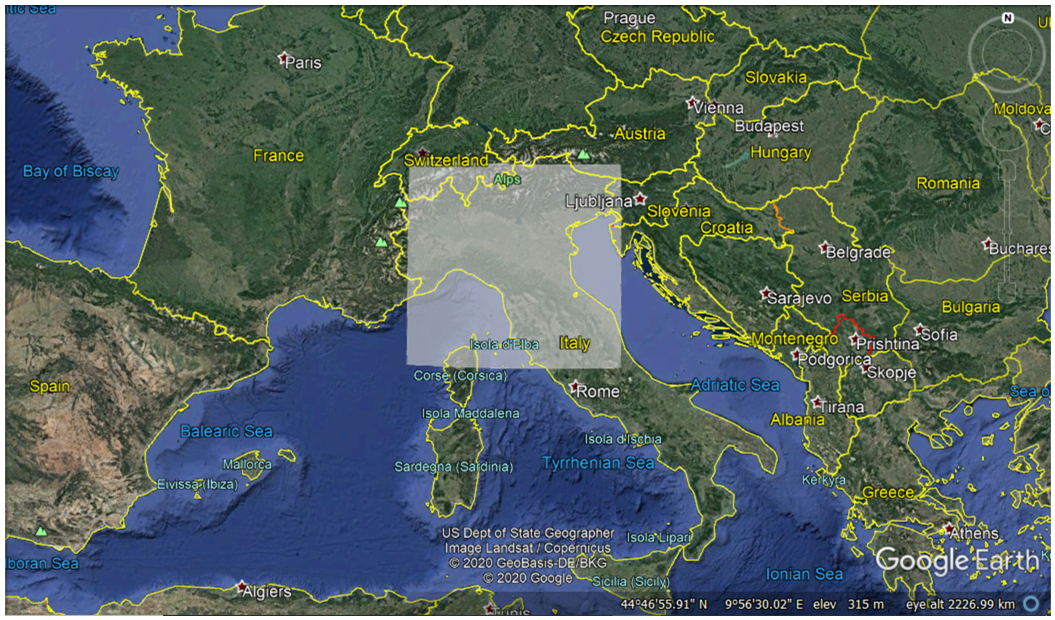
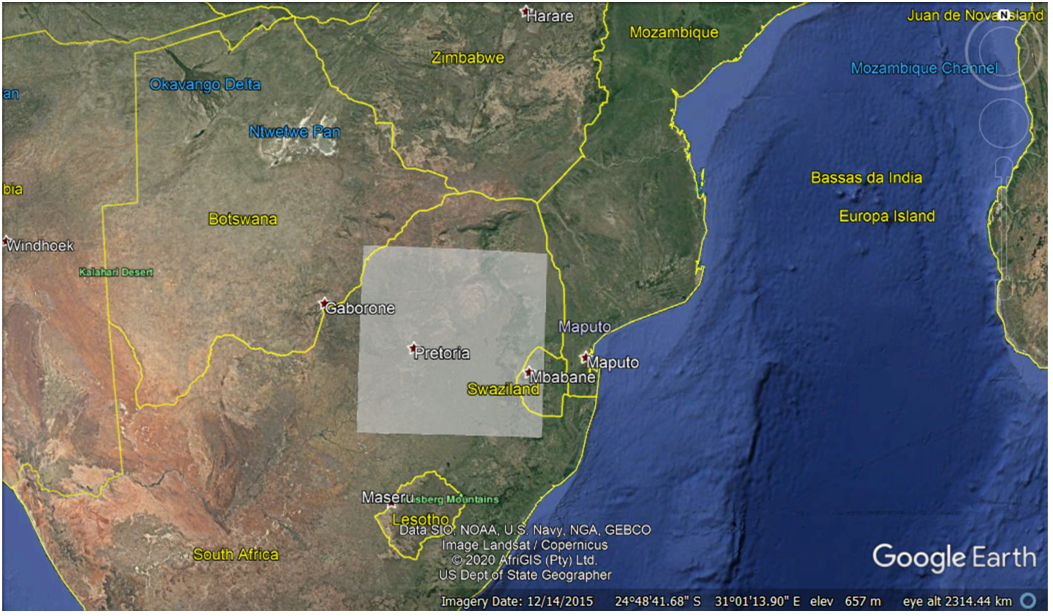
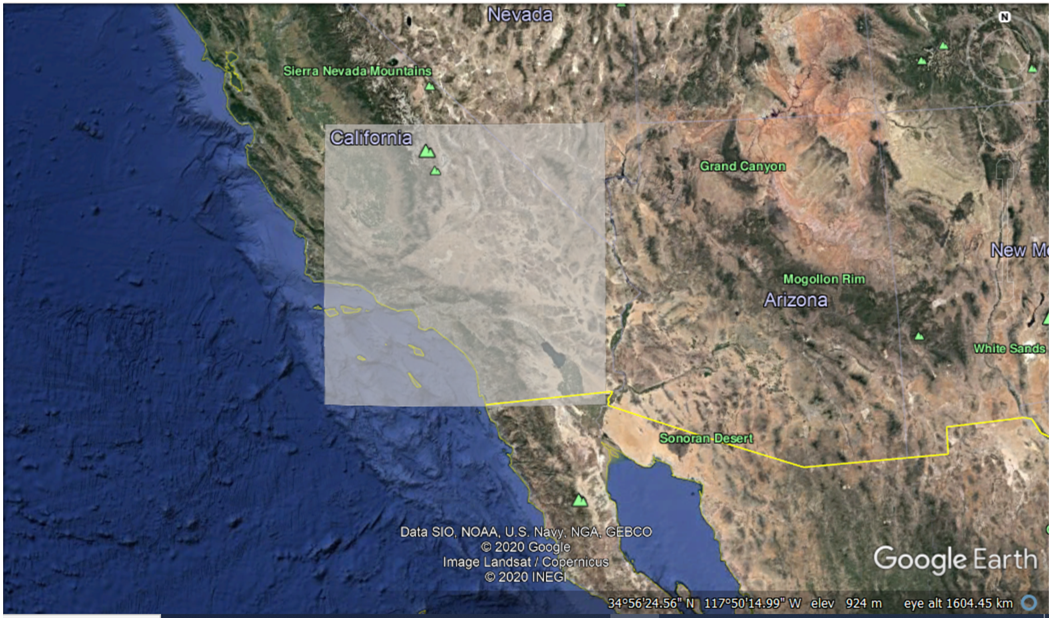
Areas of Interest
The challenge execution must be performed on all the three following geographical areas:
- North Italy
- South Africa
- California
Metrics
In the scoring of the participants’ results different metrics will be applied. The first set of metrics will be computed on a pixel basis by comparing the values of the AI models’ outputs for the PM2.5 and NO2 parameters at improved spatial resolutions with the values of the ground monitoring stations. This first set of metrics include:
- Root Mean Square Error (RMSE)
- Pearson's Correlation (Corr)
- Factor of 2 (Fact2)
The second set of metrics are applied to evaluate the spatial variation consistency of the improved spatial resolution PM2.5 and NO2 AI models’ outputs with respect to the data at their native spatial resolution. This second set of metrics include:
- False Alarm Ratio (FAR)
- Probability of Detection (POD)
- Diagnostic Odd Ratio (OddR)
- Intersection Over Union (IOU)
You can find details on how to compute this metrics here.
Leaderboard formation
The different metrics reported above will be computed by the live scoring tool on the AI4EO platform, after each submission of the teams. The values obtained by each team in the different metrics, and for all the geographic Areas of Interest, will determine the position of the team in the overall leaderboard. For each AoI the computation of the scores of each team is performed as follows:
- For each metric the team with the best-performance is classified in the first position, the team with the second best-performance is classified in the second position and so on.
- A score equal to 1 is assigned to the team in the first position, a score equal to 2 is assigned to the team in the second position and so on.
- The scores achieved in all metrics are then added together and the team which has obtained the smaller overall score is classified in the first position of the leaderboard, the team with the second smaller overall score is classified in the second position and so on. In case of parity of the total scores of one or more teams, the last but one total scores of the involved teams will determine the relative position between the involved teams.
Instructions for data handling
The AI4EO team provided a set of technical tools for handling the different phases of the challenge. The set of tools include a dedicated Docker and a Jupyter Notebook for supporting the data handling as well as the development of the AI models, their tests and their application for producing the final results. The step-by-step set of instructions for the different data handling (reading, manipulation, plotting, ecc.) are included into a dedicated Jupiter notebook available here.