

HYPERVIEW 2
#HYPERVIEW2
Challenge closed
Data objective of the challenge
The objective of HYPERVIEW2 is to estimate the concentration of six, equally-important soil contaminants/trace elements: Boron (B), Copper (Cu), Zinc (Zn), Iron (Fe), Sulphur (S), and Manganese (Mn) in top soil using satellite imagery.
Dataset
The dataset consists of hyperspectral and multispectral images presenting the parcels of land with associated ground truth measurements obtained by examining soil samples collected on-site (they underwent the laboratory analysis to extract image-level ground- truth labels for each soil parameter). Each image corresponds to one field used for agricultural purposes.
There are 3764 fields of interest in total.
The image data includes airborne hyperspectral images, Sentinel-2 multispectral satellite images and PRISMA hyperspectral satellite images:
- Airborne hyperspectral images were acquired with an airplane, cruising at 2760 meters above sea level, with speed 61.7 m/s. The images were acquired with HySpex VS-725 set, collecting 430 bands, ranging from 414 to 2357 nm. Airborne hyperspectral images are, however, released for the training set (T) only (i.e., they are not available for the validation/test set).
- The Sentinel-2 data captures multispectral images with 13 spectral bands, with the GSD (ground sampling distance) ranging from 10 m to 60 m. However, all bands are upscaled to 10 m GSD.
- PRISMA (PRecursore IperSpettrale della Missione Applicativa) is an Italian Earth observation satellite launched in 2019, with a dual hyperspectral and panchromatic camera payload. The PRISMA images in HYPERVIEW2 are comprised of 230 spectral bands (400-2500 nm, 10 nm spectral sampling), with the GSD of 30 m.
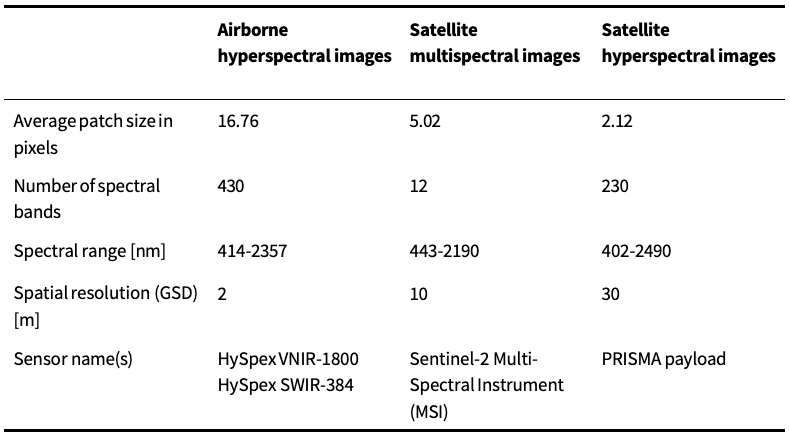
See the characteristics of both Sentinel-2 and PRISMA HYPERVIEW2 images in Table 1.
Table 1. Summary of characteristics of the imaging data sources
Overall, the HYPERVIEW2 dataset contains:
- 1876 fields of interest in the training set T
- 944 fields of interest in the validation set V
- 1888 fields of interest in the test set Ψ
For each field of interest (of varying sizes), we release:
- Hyperspectral airborne image (430 bands) with the soil mask – note: this modality is released for the training set T only
- Hyperspectral satellite image (230 bands) with the soil mask
- Multispectral satellite image (13 bands) with the soil mask
- Ground-truth (GT) 6-value vector containing 6 laboratory extracted soil parameters: Boron (B), Copper (Cu), Zinc (Zn), Iron (Fe), Sulphur (S), and Manganese (Mn) (released only for T). Therefore, HYPERVIEW2 contains image- level GT labels.
The examples of hyperspectral and multispectral images are shown in Figure 1.
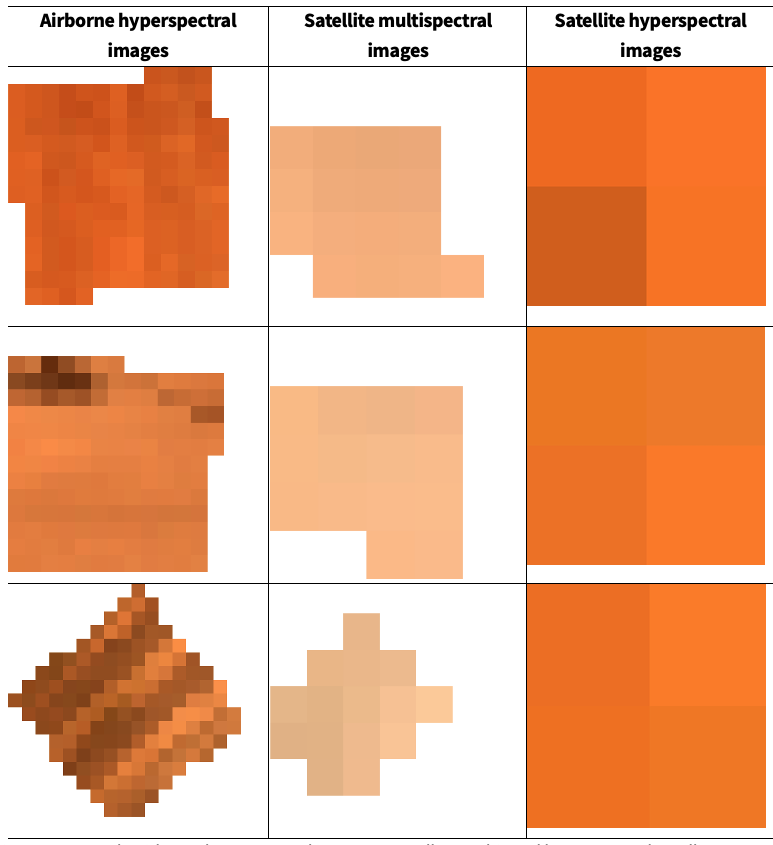
Figure 1. Example airborne hyperspectral images, as well as multi- and hyperspectral satellite images of selected parcel of interest from the training set T.
Metrics
The HYPERVIEW2 challenge focuses on two aspects of machine learning models: their prediction capability (i.e., the quality of soil parameters’ estimations), as well as on their robustness investigated through applying appropriate XAI techniques.
Accordingly, The HYPERVIEW2 Challenge will comprise two stages:
- Assessing the prediction performance of the models (the quality of soil parameters’ estimation should be maximized)
- Assessing the robustness of the models using XAI methods
Assessing the prediction performance of the models: HYPERVIEW Score
The participants of the challenge are given a set of training examples (with GT image-level labels for all soil parameters). Given the training data, the Teams develop their solutions that will be validated over the test data, for which the target (GT) parameter values are not revealed. The score obtained by a Team is calculated using the HYPERVIEW Score:
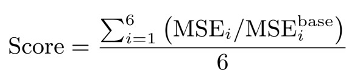
where
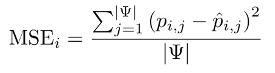
and ∣ψ∣ denotes the cardinality of the test set.
We calculate six MSE values over the entire test set ψ, one for each soil parameter (B, Cu, Zn, Fe, S, and Mn), and divide them by the corresponding MSE value obtained using a trivial baseline algorithm which returns the average parameter value obtained from the training set T.
The lower score values denote the better solutions, with Score=0 indicating the perfect one.
Illustrative example for HYPERVIEW score
Let us assume the following:
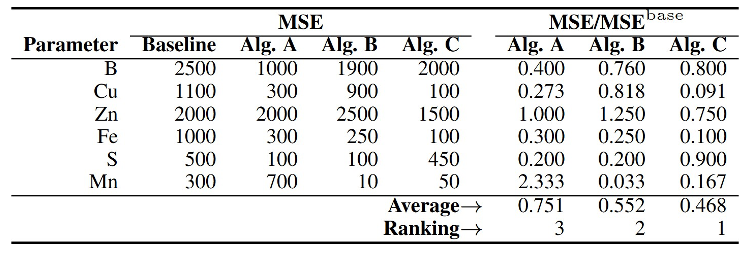
- We have three competing algorithms: Algorithm A, Algorithm B, and Algorithm C, resulting in some MSE values obtained for 6 soil parameters of interest (B, Cu, Zn, Fe, S, Mn).
- The trivial baseline algorithm obtains the following MSE scores (over the entire test set) for B, Cu, Zn, Fe, S, Mn: 2500, 1100, 2000, 1000, 500 and 300, respectively.
Table 1 gathers the baseline MSE together with the MSE values obtained by the algorithms A – C, and divided by the baseline MSE. The baseline MSE reflects the performance of the algorithm that returns the average value of each soil parameter obtained for the training set – the implementation of this algorithm is included in the Jupyter starter pack for convenience. These MSE values are mapped to the HYPERVIEW scores (and the corresponding ranking) presented in Table 1. Therefore, Algorithm C is the winner and outperforms Algorithm B and Algorithm A.
Table 1: The baseline MSE, together with the MSE obtained using three competing algorithms A – C and their ranking.
Assessing the XAI analysis
After the HYPERVIEW2’s XAI Checkpoint
- The teams will be given up to 5 top-performing models as of July 14, 2025 (according to the HYPERVIEW Score obtained over the test set)
- The teams will have to apply their XAI methods to investigate, validate and “red- team” the top-performing models, as well as their own best model (according to the HYPERVIEW Score obtained over the validation set from any point in time)
The XAI analysis will undergo the assessment process, in which all organizers will be involved. To objectify this assessment, we will prepare a questionnaire (up to 10 questions scored using a simple scale, e.g., 0, 1, and 2) to assess different aspects of the XAI analysis. The questions included in the questionnaire might encompass the following ones (this list is not meant to be exhaustive):
- Are the XAI techniques presented in detail and thus reproducible? (No – 0, Partly – 1, Yes – 2)
- Were the XAI techniques applied in an unbiased way? (No – 0, Yes – 2)
- Are the XAI explanations unbiased and interpreted correctly? (No – 0, Partly – 1, Yes –2)
- How novel are the proposed XAI methods? (Not at all – 0, Partly – 1, Innovative – 2)
After collecting all questionnaires, we will calculate the mean opinion score.
For assessing the XAI approaches developed by the participants, the following events will play a key role.
At the EASi workshop at ECAI 2025
The authors will present their XAI techniques, and the results of their analysis during the workshop. Here, the emphasis shall be put on the comparison of the robustness of the algorithm proposed by a corresponding team with the robustness of all other top-performing models shared with the participants.
Assessing the HYPERVIEW2 submissions: the final score
The final ranking will be impacted by both the HYPERVIEW Score and the quality of the XAI analysis developed by the participants. Thus, we will:
- Calculate the performance ranking using the HYPERVIEW Scores (the lower, the better) for the submissions at the XAI Checkpoint
- Calculate the XAI ranking based on the assessment of the XAI analysis (the higher, the better)
- Calculate the final ranking, being the average of the positions in the two above-discussed rankings
Leaderboard
The submitted entries will be ranked based on the HYPERVIEW Score.
To reduce the probability of over-fitting to the test set, the participants will only see their results obtained over a subset of the entire test set (50% of all test samples), referred to as the validation set (V). Note that, in this case, the MSE value obtained by the baseline (“trivial”) solution returning the average value of each parameter will be calculated for V too.
When the challenge closes, the final ranking will be re-computed based on the entire test set. This may lead to changes in the final ranking positions, since the HYPERVIEW score on the validation set – being a random subset of 50% test examples – may differ from the HYPERVIEW core obtained over the entire test set. Thus, the public leaderboard shows the results of 50% of all test samples, and the final ranking is re-computed over the entire test set.
Getting started
To help participants get started with the challenge, we prepared a Jupyter notebook (Starter Pack) to guide teams through the data I/O, visualization, prediction using a baseline algorithm, and creating a valid submission. Also, to help participants start with XAI techniques for remote sensing, we encourage the authors to explore the examples of deploying XAI methods over hyperspectral imagery using the Meteors package available at https://github.com/xai4space/meteors